Intelligent Operations Dashboard
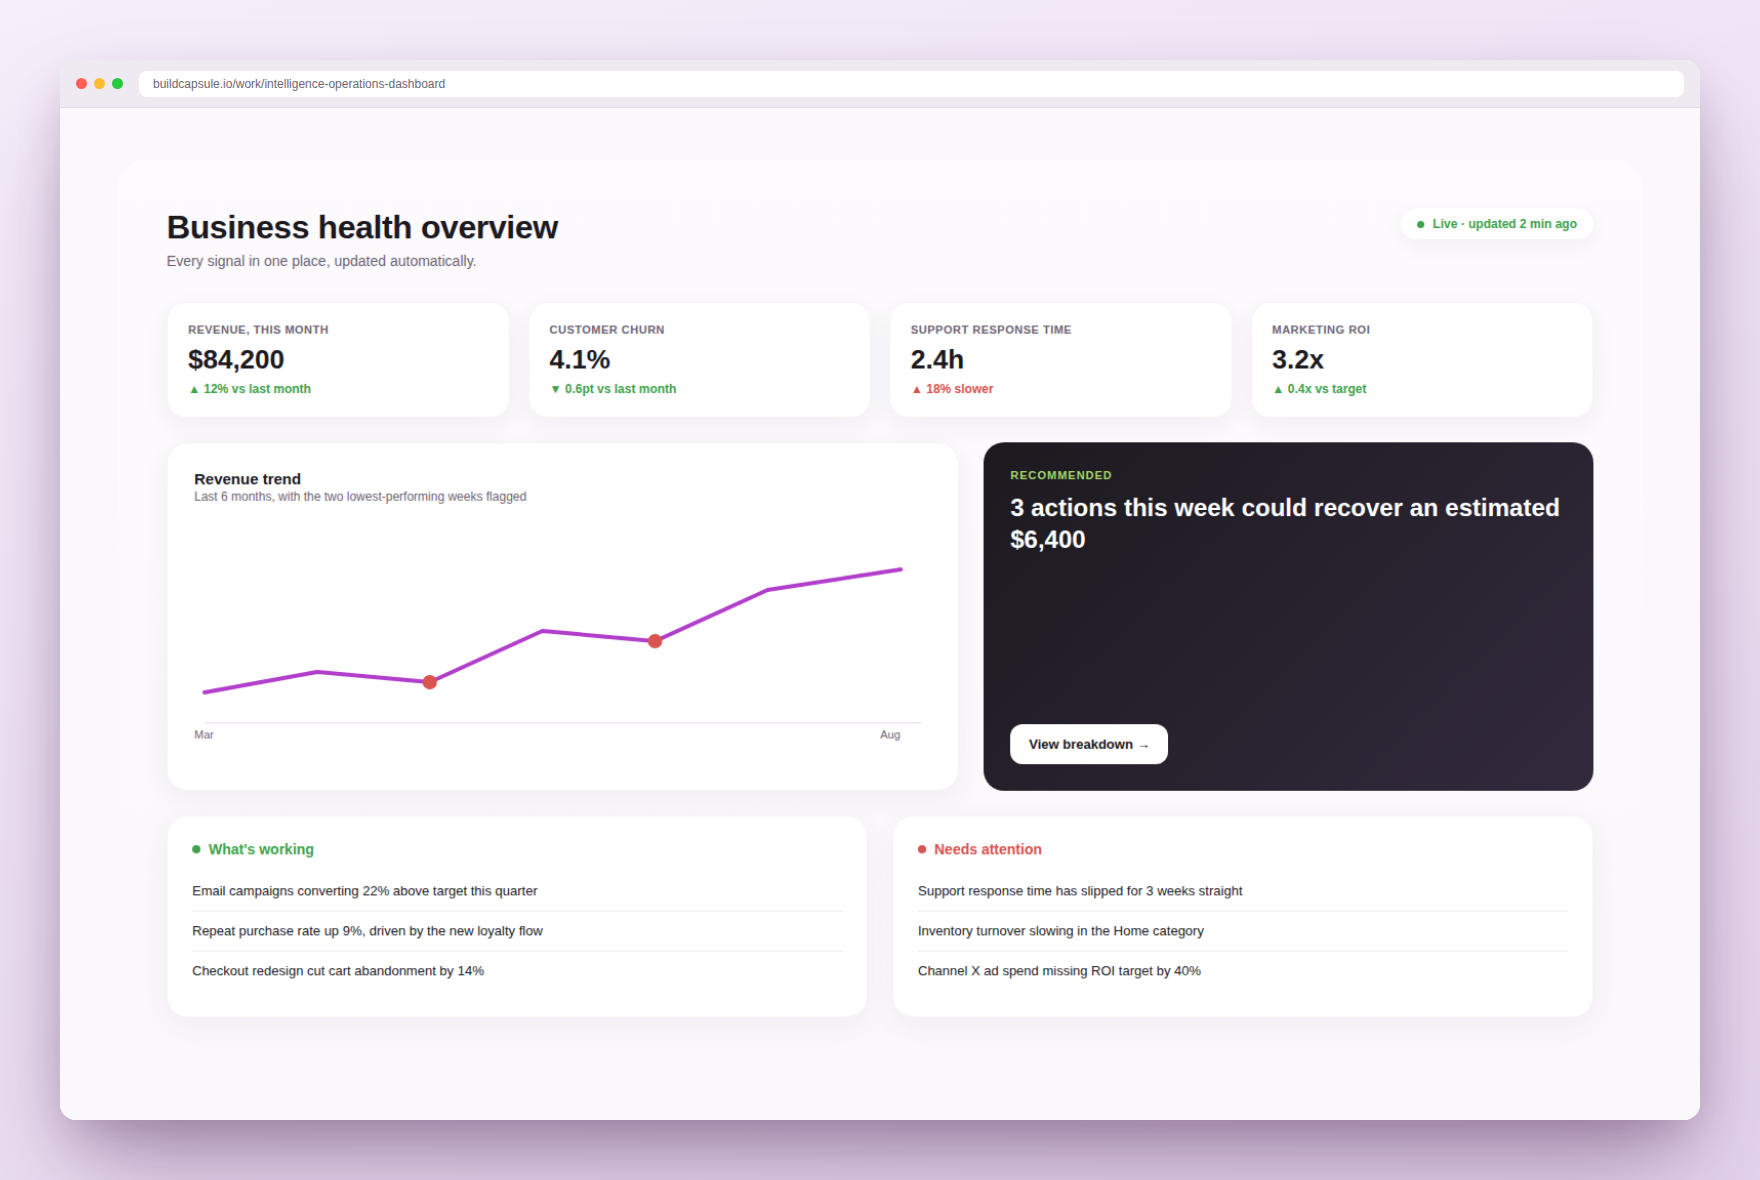
A prototype operations view that reads process telemetry and surfaces the bottleneck before anyone files a ticket.
Challenge
Operations teams usually discover a broken process from the complaint, not the data. The prototype explores what an always-on read of process health could look like.
Thinking
Started from business analysis rather than charts: mapped a fictional order-to-cash flow, identified where handoffs stall, and only then designed the surfaces that would make a stall visible.
Solution
A process-health prototype that translates event data into operator-readable signals.
Build
A prototype dashboard fed by simulated event streams, with anomaly flags, a stage-by-stage cycle-time view and a plain-language daily summary generated from the same data.
Experience
Quiet by default, loud when it matters — the layout stays calm until a stage degrades, at which point that stage expands and takes visual priority.
Outcome
Prototype demonstrates how process telemetry can be framed for non-technical operators. Data is simulated; no client system, no production rollout, no efficiency figures claimed.
Reflection
The plain-language summary was the part stakeholders reacted to — charts explained, sentences convinced.
Gallery

Next capsule
AI Travel Companion